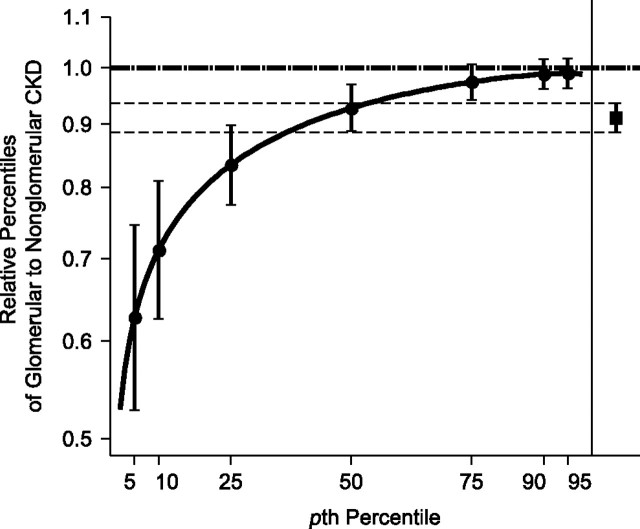
Figure 2.
Generalized gamma (GG)-modeled relative percentiles of annualized glomerular filtration rate (GFR) ratio in children with glomerular chronic kidney disease (CKD) versus children with nonglomerular CKD, Chronic Kidney Disease in Children Study, 2005–2010 (n = 529). The solid black curve represents ratio estimates (95% confidence intervals are shown as vertical brackets at highlighted percentiles) of percentiles of GG(0.003, 0.132, 2.100) for children with glomerular diagnosis to percentiles of GG(−0.014, 0.109, 0.782) for children with nonglomerular diagnosis. For comparison, the estimated relative percentile (and 95% confidence interval) in annual change in GFR for children with glomerular CKD versus those with nonglomerular CKD using a random intercepts and slopes linear mixed model with log-transformed GFR as the outcome is shown on the right side of the figure (and as thin, dashed lines). The nonglomerular CKD reference group is indicated by the horizontal dashed line at 1.0.

