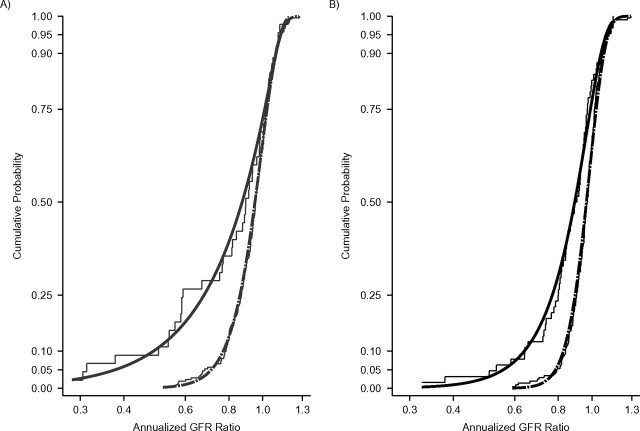
Figure 3.
A) Generalized gamma cumulative distribution functions of annualized glomerular filtration rate (GFR) ratios for 212 children with nonglomerular chronic kidney disease (dashed curve) and 45 children with glomerular chronic kidney disease (solid curve) with a baseline GFR level of 45 mL/minute/1.73 m2 of less from the Chronic Kidney Disease in Children Study, 2005–2010. Diagnosis-specific empirical cumulative distributions of annualized GFR ratios are shown as thin gray step curves. B) Generalized gamma cumulative distribution functions of annualized GFR ratios for 208 children with nonglomerular chronic kidney disease (black dashed curve) and 64 children with glomerular chronic kidney disease (black solid curve) with a baseline GFR level greater than 45 mL/minute/1.73 m2. Diagnosis-specific empirical cumulative distributions of annualized GFR ratios are shown as thin black step curves.

