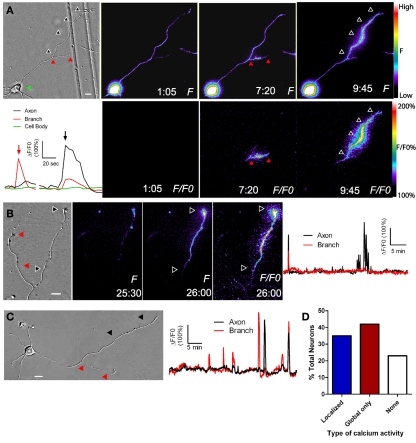
Figure 2.
Localized calcium transients occur in restricted regions of primary axons or their collateral branches. (A) DIC image at left and fluorescence images of calcium activity in a cortical neuron in which calcium transients are localized to the primary axon (at 9:45) or its collateral branch (7:20). At 1:05 there is no calcium activity. Black and red arrowheads correspond to regions of localized calcium activity. Panels F/FO show fluorescence change from baseline rather than raw fluorescence (lower panels). Pseudocolor calibration bars for images of raw fluorescence (F) and fluorescence normalized to baseline (F/FO) are shown at right. The graph at left shows calcium activity in the primary axon (black), branch (red), and cell body (green) during calcium transients shown in the fluorescence images at 7:20 (red arrow) and 9:45 (black arrow). (B) DIC image (left) and fluorescence images of localized calcium activity indicated by black arrowheads in the primary axon of a cortical neuron (right panels). As shown in the graph of calcium activity (far right), localized calcium transients occurred only in the primary axon (black), and not in the branch (red). One global calcium transient occurred at the beginning of the imaging session. (C) Both the primary axon (black arrowheads) and branch (red arrowheads) show localized calcium transients but the branch has a higher frequency (graph at right). (D) Distribution of total cortical neurons with different types of calcium activity. Times are in minutes and seconds. Scale bar, 10 μm. (Reprinted from Hutchins and Kalil, 2008; with permission from the Society for Neuroscience).

