Figure 2.
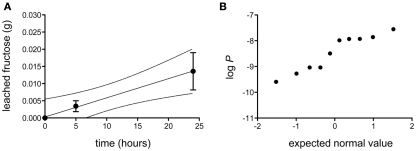
Diffusion of fructose across isolated Populus x canescens leaf cuticles. (A) Accumulation of fructose (in grams) as a function of time at a donor concentration of 0.18 g mL−1. Shown is the linear regression (r2 = 0.99) with 95% confidence intervals (broken lines) of the mean (n = 10) diffusion of fructose over Populus x canescens leaf cuticles. Error-bars represent the standard error of measurement. (B) Probability plot of the log-transformed fructose permeability (P, in ms−1) of individual Populus x canescens CMs. The dataset passed the D’Agostino and Pearson omnibus test for normality (P = 0.28).

