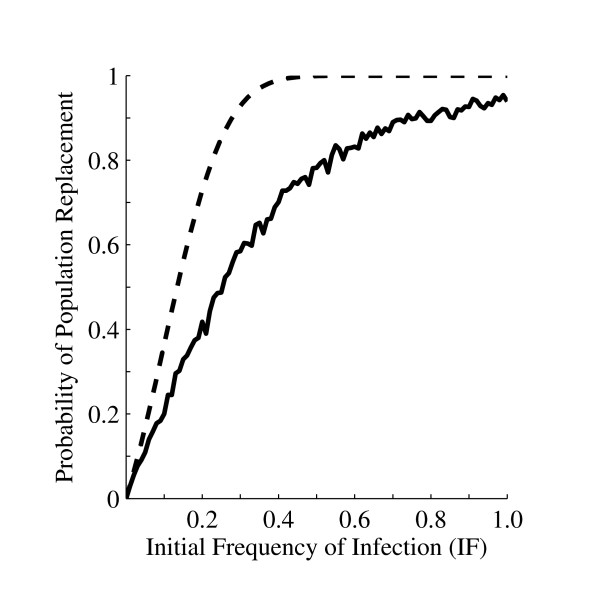
Figure 5.
The probability of population replacement by Wolbachia given different initial infection frequencies. This figure assumes that the relative fecundity of infected females is 0.95, with perfect CI and maternal inheritance. The dashed line indicates the probability of population replacement as calculated by Jansen et al [22], and the solid line represents the predictions of this model. Our model predicts lower probabilities at all initial Wolbachia infection frequencies, but generates a similar functional response.

