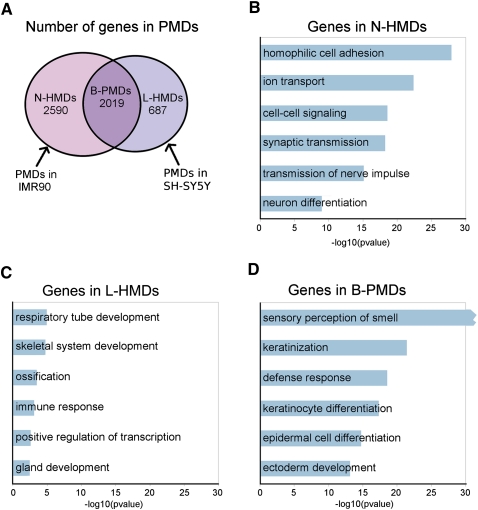
Figure 4.
The characteristics of genes in PMDs. (A) Venn diagram showing overlap of PMDs between SH-SY5Y and IMR90 cells. The numbers of genes in each domain type are shown. (B–D) GO biological process classifications for genes in each domain type using DAVID. Bonferroni correction was applied to the P-values. Redundant GO terms containing similar lists of genes were excluded and a full list can be found in Supplemental Table 1. Because of the large number of olfactory receptor genes in B-PMDs, the “sensory perception of smell” category had a Bonferroni P-value of 2.9 × 10−277.

