Figure 5.
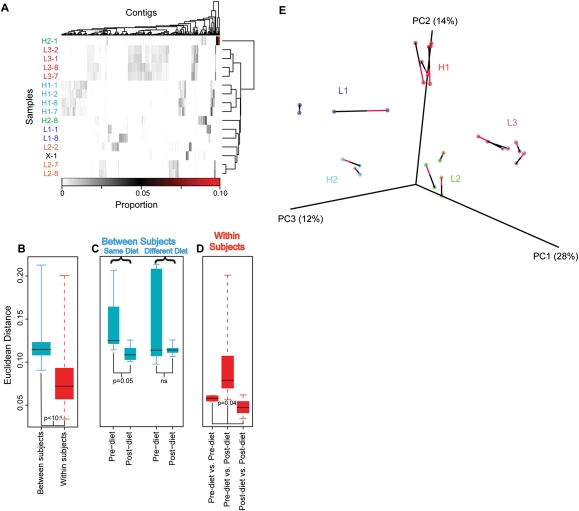
Alterations in VLP contig abundance associated with diet. (A) Proportions of VLP sequence reads in contigs from different subjects and time points. Vertical bars indicate the proportion of reads within each contig. The contigs are shown in columns, and subject/time-point combinations in rows. Hierarchical clustering was performed on both rows and columns according to Euclidean distance and complete distance agglomeration. Samples are labeled by subject according to diet: high-fat (H1, H2), low-fat (L1, L2, L3), and ad-lib (X), as well as day of dietary intervention (days 1, 2, 7, or 8). The proportion of all VLP reads in each contig are shown by the scale at the bottom. (B,C,D) The Euclidean distance between samples is shown according to median (line), quartile (box), and range (whisker). (B) Between-subject variation is significantly greater than within-subject variation (P < 10−4, subject label permutation). (C) The distance between the gut viromes of individuals on the same diet (left) was significantly smaller at the end of their dietary treatment than it was at the start (P = 0.05, permutation of diet labels), while there was no increase in similarity for individuals on different diets (right). (D) The distances within subjects that was measured between samples taken on the first 2 d of the timecourse (left) and the last 2 d of the timecourse (right) were significantly lower than the distances between those two sets of days (middle; P = 0.04, permutation of day labels). (E) Covariation of bacterial and VLP community diversity. Distances between pairs of bacterial and VLP communities were calculated as described in the Methods. The similarity of bacterial and VLP communities is shown through PCoA analysis, where each data set was rotated and scaled for maximum superimposition. Each circle represents a sample, either bacterial or VLP. The bacterial and VLP communities from the same sample are connected by a line, where the red half of the line touches the VLP community, and the black half touches the bacterial community. The percent of total variation accounted for by each axis is shown in the axis label. The alignment of bacterial and VLP communities was highly significant (P = 0.004).

