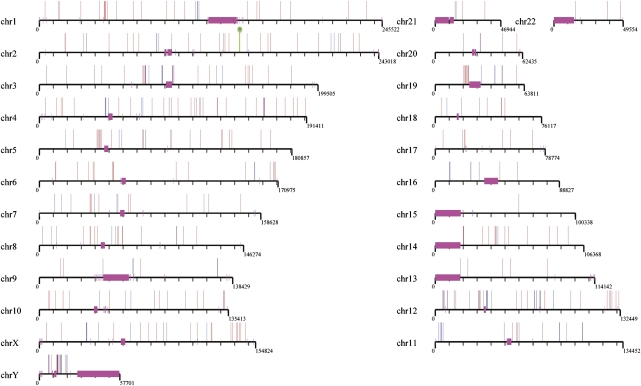
Figure 2.
Endogenous retroviral integration map. A comparison of chimpanzee (n = 275, blue) and gorilla (n = 265, red) PTERV1 sites of integration based on mapping to the human genome. None of the map positions in the two genomes are orthologous except one (indicated in green and corresponding to gorilla chr2: 143467521-143467682; chimpanzee chr2: 143467889-143468851). The endogenous retroviral element is absent in human and orangutan genomes and appears to have expanded largely independently in the two lineages after they diverged.

