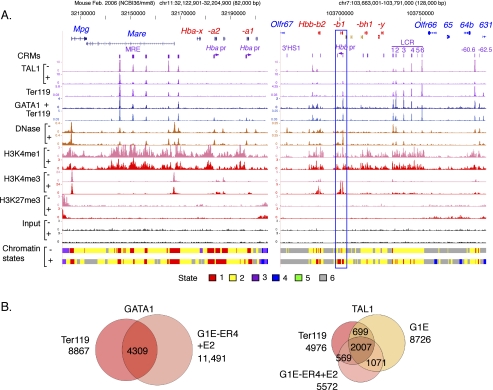
Figure 1.
Comparison of ChIP-seq data for transcription factor occupancy between primary erythroid cells and the G1E cell system. (A) Factor binding and histone modification profiles are shown for the Hba locus encoding alpha-globins (left) and the Hbb locus encoding beta-globins (right) on the mouse mm8 assembly. The tracks shown are genes; known cis-regulatory modules (CRMs); TAL1 occupancy; GATA1 occupancy; DNase hypersensitivity; modification of the chromatin by H3K4me1, H3K4me3, or H3K27me3; input (a control in which no antibody is used in the immunoprecipitation); and the chromatin states derived from the multivariate HMM analysis. The signal tracks are paired (identical vertical scales) by the absence (G1E cells, denoted by the minus [−]) or presence (G1E-ER4+E2 cells, denoted by the plus [+]) of GATA1 in the cell line assayed to facilitate comparison of amount of change for each feature (except GATA1, which is absent from G1E cells). TAL1 and GATA1 patterns are also shown for Ter119+ primary erythroblasts. For most tracks, mapped read counts (normalized for the total number of mapped reads in the experiment) in 10-bp windows are plotted; the DNase-seq tracks were processed by F-seq (Boyle et al. 2008b). The blue box outlines the Hbb-b1 gene, which does change chromatin states upon induction during differentiation. (B) Venn diagrams illustrating the overlaps in peaks called for GATA1 and TAL1 in the primary erythroblasts and in the G1E cell system. Total numbers of peaks are listed outside the circles, and the numbers in each intersection are given.

