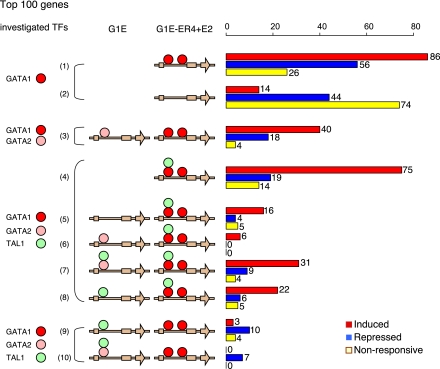
Figure 6.
Dynamics of transcription factor occupancy for genes that respond differently to GATA1. Occupancy by TAL1 and/or GATA2 in G1E cells is displayed on the left set of brown arrows (indicating gene neighborhoods), and occupancy by TAL1 and/or GATA1 is displayed on the right set of arrows. Any number of occupied segments for each TF within each gene neighborhood is indicated by the appropriate colored circle (red for GATA1, green for TAL1, and pink for GATA2). Considering the 100 most induced genes (red bars), the 100 most repressed genes (blue bars), and the 100 least responsive genes (yellow bars), the bar graph on the right shows the number of genes in each response category that shows the indicated patterns of occupancy.

