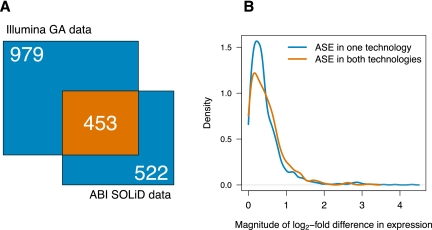
Figure 3.
Concordance of measurements of ASE obtained using different sequencing platforms. (A) Overlap between genes showing significant ASE at FDR = 5% for two sequencing platforms. (Orange square) Genes called significant in data from both platforms. (Blue squares) Genes called significant on only one platform, indicated on the far side of the square. Numbers in white indicate the number of genes falling into each category; the area of each square is proportional to this number. (B) Magnitude of log2-fold difference in gene expression for genes called significant at FDR = 5%. Log2-fold differences are computed with respect to the allele with lower expression, causing all values to be positive. Lines shown are continuous approximations to discrete densities. (Blue line) Density for genes called significant using only one sequencing platform. (Orange line) Density for genes called significant in data from both sequencing platforms.

