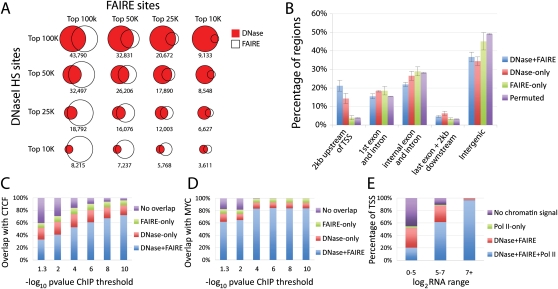
Figure 2.
DNase-seq and FAIRE-seq identify overlapping and unique sets of open chromatin. (A) Comparisons of the top 10K, 25K, 50K, and 100K DNase-seq and FAIRE-seq peaks from a single cell line (GM12878), with overlap indicated below each Venn diagram. (B) Average percentage of DNaseI and/or FAIRE peaks, as well as permuted coordinates, in defined positional categories based on their relationship to annotated genes. Error bars represent the standard deviation over seven cell types. Several categories deviated significantly from random (Supplemental Table S2). (C) The percentage of CTCF ChIP-seq peaks that overlap DNaseI and/or FAIRE sites in all seven cell types. The x-axis values indicate different signal thresholds for calling sets of CTCF peaks, where the threshold is increasingly more stringent from left to right. (D) The same as C, except for MYC ChIP-seq data. (E) Percentage of TSSs with overlapping Pol II ChIP-seq, DNaseI, and/or FAIRE peaks in seven cell types. x-axis represents expression values for corresponding genes indicating high (7+), medium (5–7), or low/no (0–5) expression.

