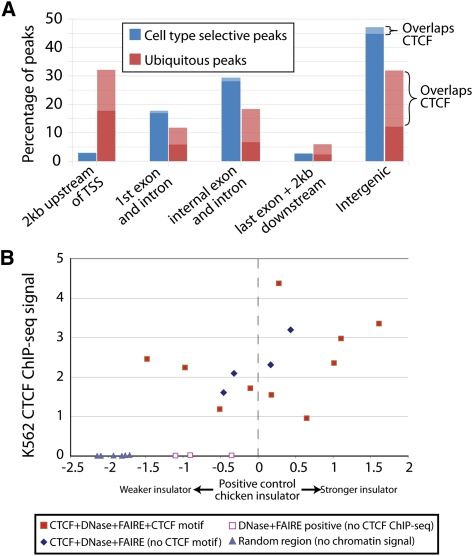
Figure 4.
Ubiquitous and cell-type selective sites differ related to transcription start sites and presence of CTCF. (A) Percentage of ubiquitous and cell-type selective open chromatin sites in positional categories relative to annotated genes. Light bars represent open sites overlapping CTCF. (B) Insulator assays performed on sites with (1) DNase-seq, FAIRE-seq, and CTCF ChIP-seq signal and a CTCF motif (filled red squares); (2) signal in all three assays but without a CTCF motif (blue diamonds); (3) DNase-seq and FAIRE-seq signal, but not CTCF ChIP-seq (open red squares); and (4) no signal in any assay (gray triangles). y-axis indicates the signal from CTCF ChIP-seq in K562 cells. Enhancer blocking values (x-axis) were calculated as described (Supplemental Methods), with a value of zero equaling the measured activity of a known insulator.

