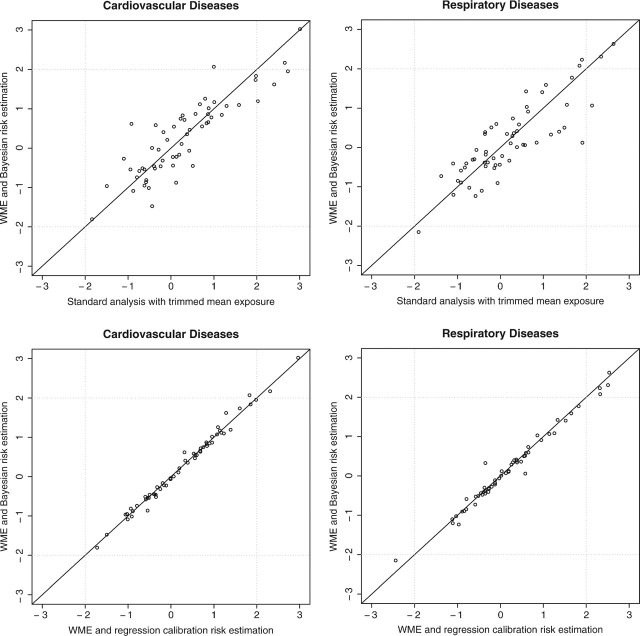
Fig. 5.
Upper panels: scatter plot of county-specific standardized health effect estimates for PM10 − 2.5,  , comparing 2 approaches: (1) including ME modeling with monitor-specific weighted error variance (WME) versus (2) using TM as PM10 − 2.5 exposure. Lower panels: scatter plot of county-specific standardized health-effect estimates for PM10 − 2.5,
  , using exposure derived from WME comparing Bayesian risk estimation versus regression calibration.

