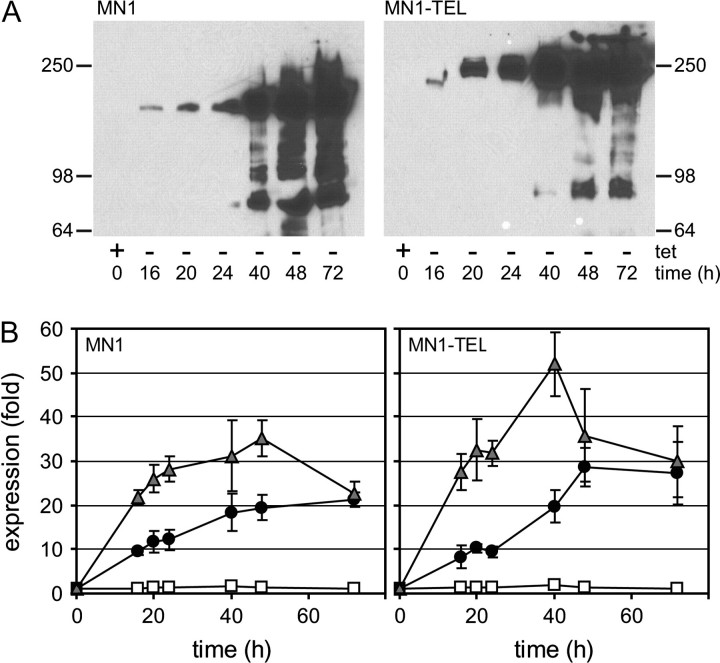
Fig. 1.
Induction of MN1 and MN1–TEL expression in U937T cells. The expression of MN1 and MN1–TEL was induced by withdrawal of tetracycline for 16, 20, 24, 40, 48 and 72 h, after which samples were collected for western blotting and real-time qPCR. The cells collected at 0 h were grown in the presence of tetracycline and without the addition of ATRA. (A) Assessment of the expression of MN1 or MN1–TEL by western blot, using an antibody raised against the N-terminal part of MN1 (2F2). (B) Assessment of the levels of MN1 and MN1–TEL messenger RNA expression by qPCR. The qPCR results were normalized, using the messenger RNA levels of POLR2A, and are presented relative to those in the presence of only the tet-repressor: white squares: +tet and +ATRA; black circles: −tet, no ATRA; gray triangles: −tet and +ATRA).

