
Fig. 2.
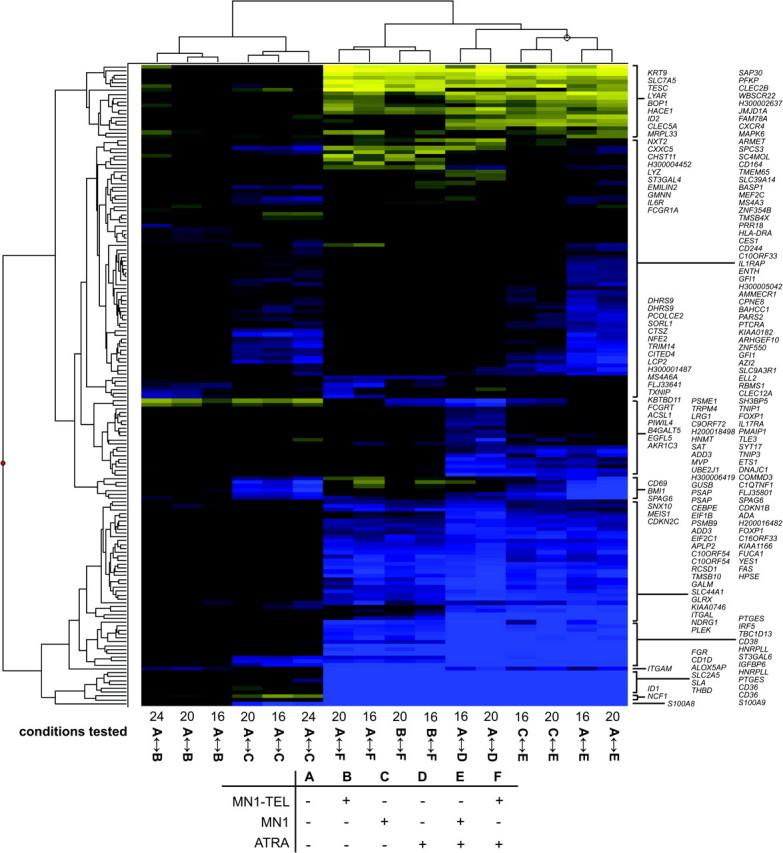
A selected set of 165 reporters cluster together for subsequent time points of MN1 or MN1–TEL expression and/or ATRA treatment in U937 cells. The log2 ratios of changes in expression between the conditions indicated were subjected to unsupervised hierarchical clustering. The conditions tested on the different arrays are indicated at the bottom with numbers (16, 20 or 24) and letter codes A–F. Numbers correspond to hours after induction of MN1 or MN1–TEL. The table underneath the figure explains the letter codes (+: presence of MN1 or MN1–TEL or ATRA; −: absence of MN1 or MN1–TEL or ATRA). For instance, A ↔ B means that a sample with induced MN1–TEL expression is hybridized against a sample without MN1–TEL expression. Blue color represents stimulation and yellow repression.