
Fig. 3.
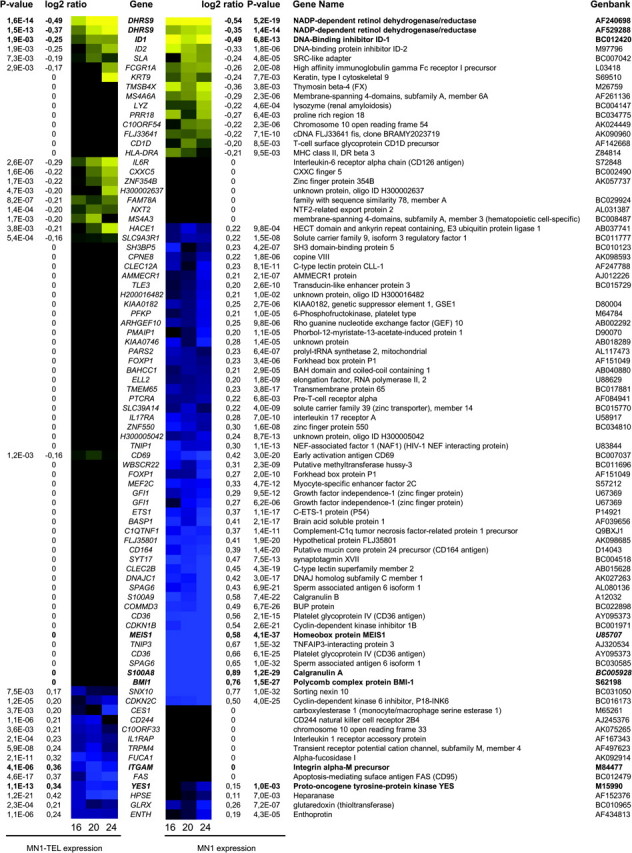
Genes regulated by MN1 and MN1–TEL. The clustering analysis was performed with expression data from the three different time points (16, 20 and 24 h after induction of MN1 or MN1–TEL). All genes listed show a significant change in expression (log2 ratio ≤0.2 or ≥0.2) for all three separate time points. The listed log2 ratios together with the P-value are calculated from combined time points. Genes indicated in bold are used for qPCR analyses (Figure 5 and 6 and supplementary Figure 5 is available at Carcinogenesis Online). Blue represents stimulation and yellow repression.