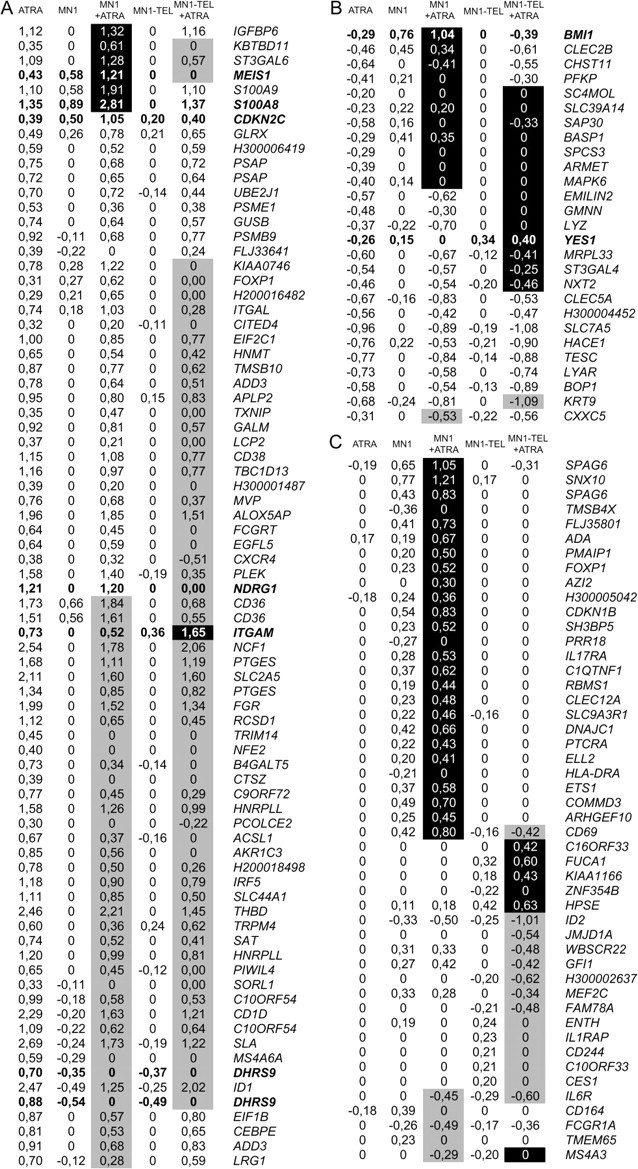
Fig. 4.

ATRA-regulated genes and the influence of MN1 and MN1–TEL on their expression. Log2 ratios of changes in expression are indicated for ATRA treatment, MN1 or MN1–TEL induction and the combination of MN1 or MN1–TEL induction and ATRA treatment. Black or gray background represents a synergistic induction or repression of ATRA effects (cutoff value log2 ratio 0.2). (A) ATRA-stimulated genes. (B) ATRA-repressed genes. (C) Genes not influenced by ATRA treatment alone, but affected by the combination of ATRA and MN1 or MN1–TEL. Gene names and Genbank number are shown in supplementary Table 2 (available at Carcinogenesis Online). Genes indicated in bold are used for qPCR analyses (Figures 5, 6 and supplementary Figure 5 is available at Carcinogenesis Online).
