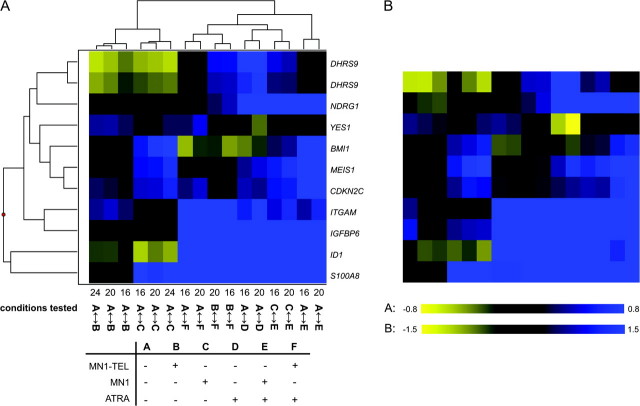
Fig. 5.
Comparison of microarray and qPCR results. The RNA samples used for microarray analysis were also used for qPCR analysis. Expression levels were determined relative to a standard curve and used without further normalization. The results were compared with the corresponding microarray data by expressing the qPCR data as mean log2 ratios. (A) Unsupervised hierarchical clustering of the microarray data (log2 ratios) for the genes selected for qPCR validation. The conditions tested on the different arrays are indicated at the bottom with numbers (16, 20 or 24) and letter codes A–F. A detailed explanation is given in legend of Figure 2. (B) Heat map of the qPCR data in the order corresponding to the unsupervised hierarchical clustering of the microarray data. Blue color represents stimulation and yellow repression.

