Fig. 6.

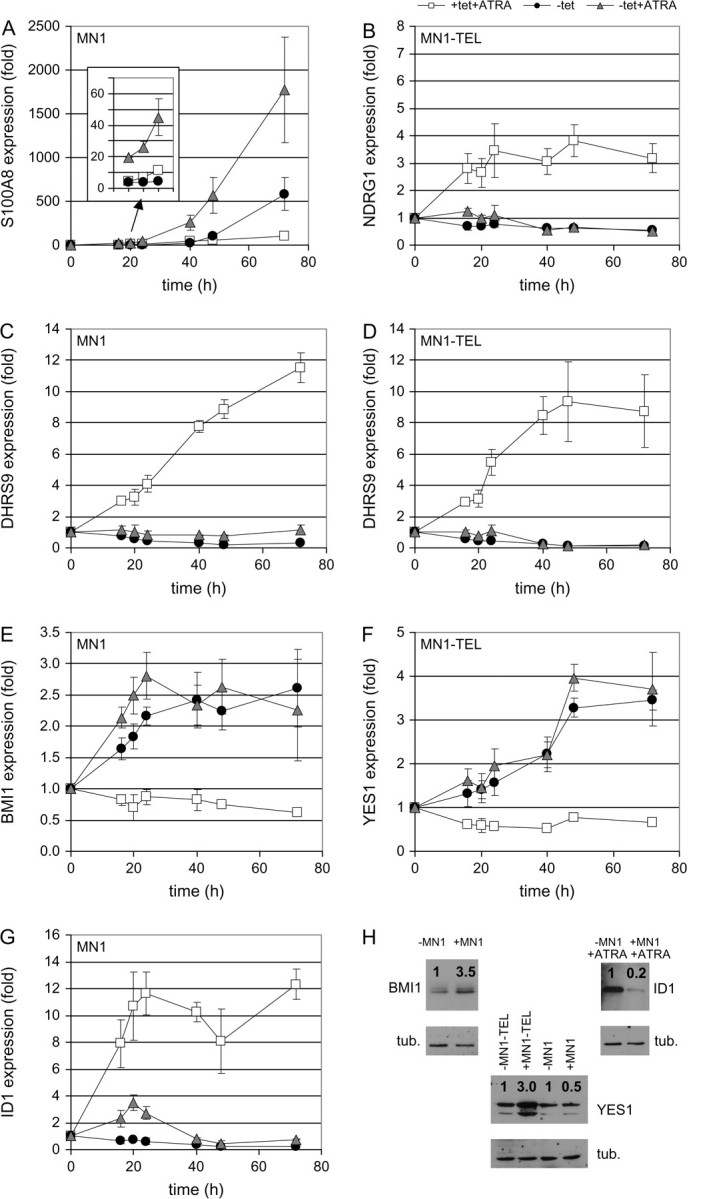
Time dependence of effects of MN1 and MN1–TEL on expression levels and validation of qPCR results by western blot. MN1 and MN1–TEL expression were induced by tetracycline release in the presence or absence of ATRA. In parallel with the RNA samples used for the microarray hybridizations (16, 20 and 24 h), samples were also collected and analyzed with qPCR for time point 0 h and longer incubation times of 40, 48 and 72 h. The qPCR results were normalized, using the messenger RNA levels of POLR2A, and are presented relative to those in the presence of only the tet repressor: white squares: +tet and +ATRA; black circles: −tet, no ATRA; gray triangles: −tet and +ATRA. The results are shown only for the cell line indicated in the upper left corner of each graph. (A) S100A8 (MN1 cell line), (B) NDRG1 (MN1–TEL cell line), (C) DHRS9 (MN1 cell line), (D) DHRS9 (MN1–TEL cell line), (E) BMI1 (MN1 cell line) and (F) YES1 (MN1–TEL cell line). Three of the target genes (BMI1, ID1 and YES1) were analyzed on the protein level. Time points after induction of MN1 or MN1–TEL expression and treatments were chosen (BMI1, 24 h; YES1, 48 h and ID1 72 h) and protein levels detected and quantified. Protein expression levels (indicated with a ratio above the signal) were calculated relative to the amount of β-tubulin present in the sample and the non-induced sample. tub. = tubulin.
