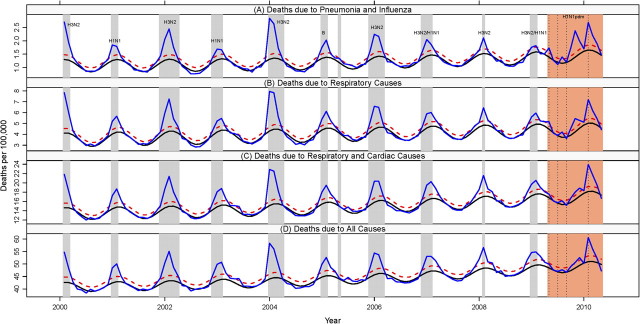
Figure 1.
Time series of monthly mortality rates coded as pneumonia and influenza (A), respiratory causes (B), respiratory and cardiac causes (C), and all causes (D), from January 2000 through April 2010, Mexico. Blue line: observed mortality rates; black line: baseline rates predicted by a seasonal regression model; red dashed line: upper 95% confidence interval of the baseline. Periods highlighted in gray mark seasonal influenza epidemic periods, while periods highlighted in orange highlight the 4 different waves of the A/H1N1 pandemic (spring 2009, summer 2009, fall 2009, winter 2010). Influenza dominant subtypes are indicated each season. See Supplementary Table 2 and Supplementary Figure 1 (online only) for additional virus surveillance data.

