6.
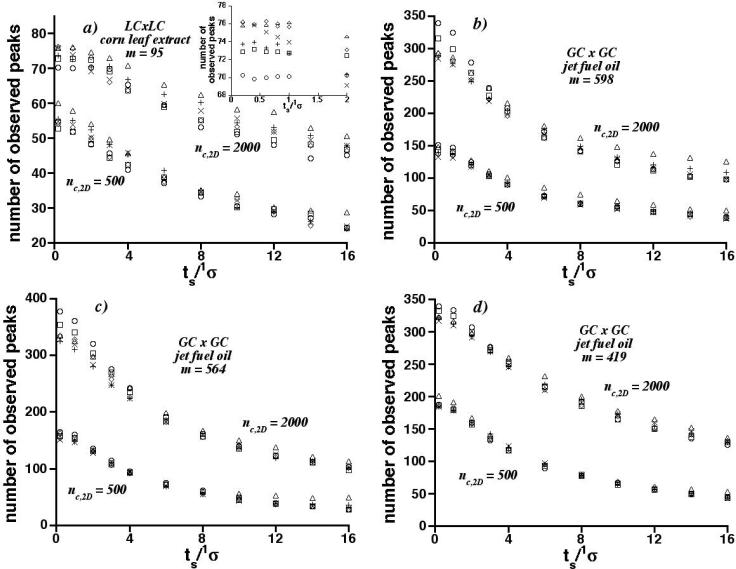
Graphs of average number of observed peaks vs. the dimensionless sampling period (ts/1σ) for constituents having retention times in Figure 5 and the arbitrarily chosen total peak capacities (nc,2D), 500 and 2000. Inset in a) shows convergence of average number of observed peaks at small ts/1σ for nc,2D = 2000. Symbols are identified in Table 1.

