8.
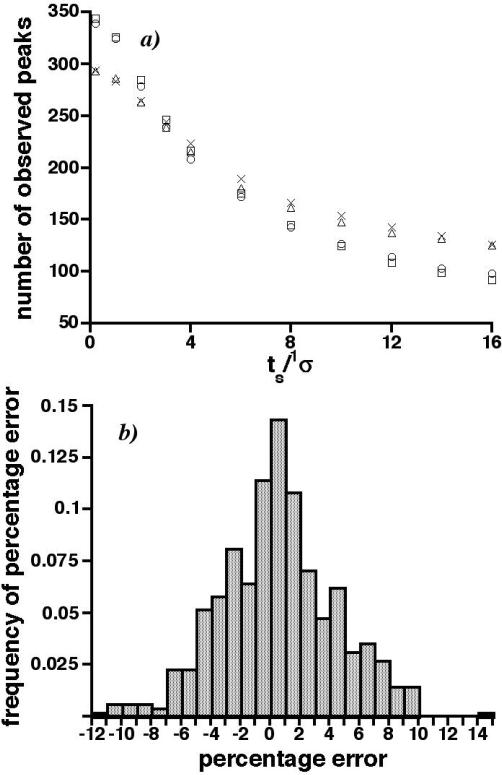
Graphs of the average number of observed peaks vs. the effective peak capacity (nc,2D) for a), b) random peak coordinates and c) - f) correlated peak coordinates in Figure 5. Data were taken from Figures 3, 4, and 6, with nc,2D calculated from total peak capacities, dimensionless sampling periods, and Eq. 3.

