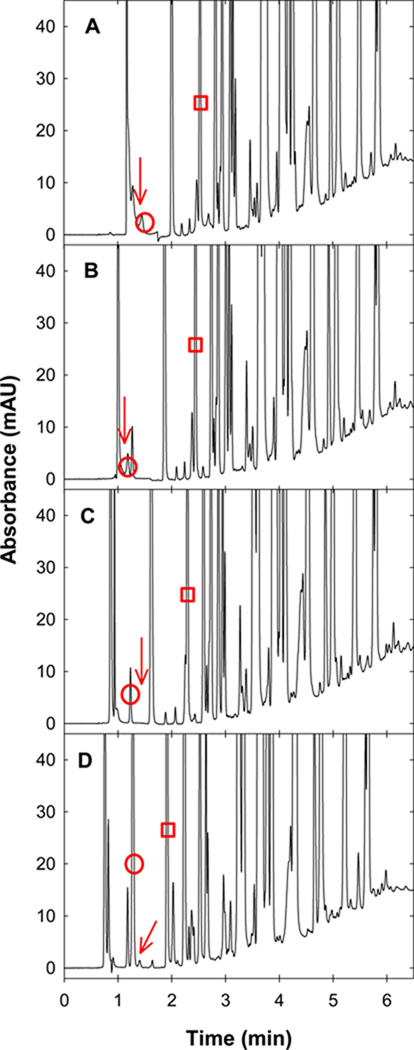
Fig. 12.
Location of the “worst” solute and “worst” solute pair when changing the gradient range. Eluent A was varied from A) 0/99.9/0.1, B) 2/97.9/0.1, C) 5/94.9/0.1 to D) 10/89.9/0.1 (v/v/v) MeCN/H2O/TFA and Eluent B was always 90/9.9/0.1 (v/v/v) MeCN/H2O/TFA. Other conditions are described in Fig. 2. The red circle identifies the “worst” solute, the red arrow identifies the “worst” solute pair and the red rectangle represents the same solute in each separation.

