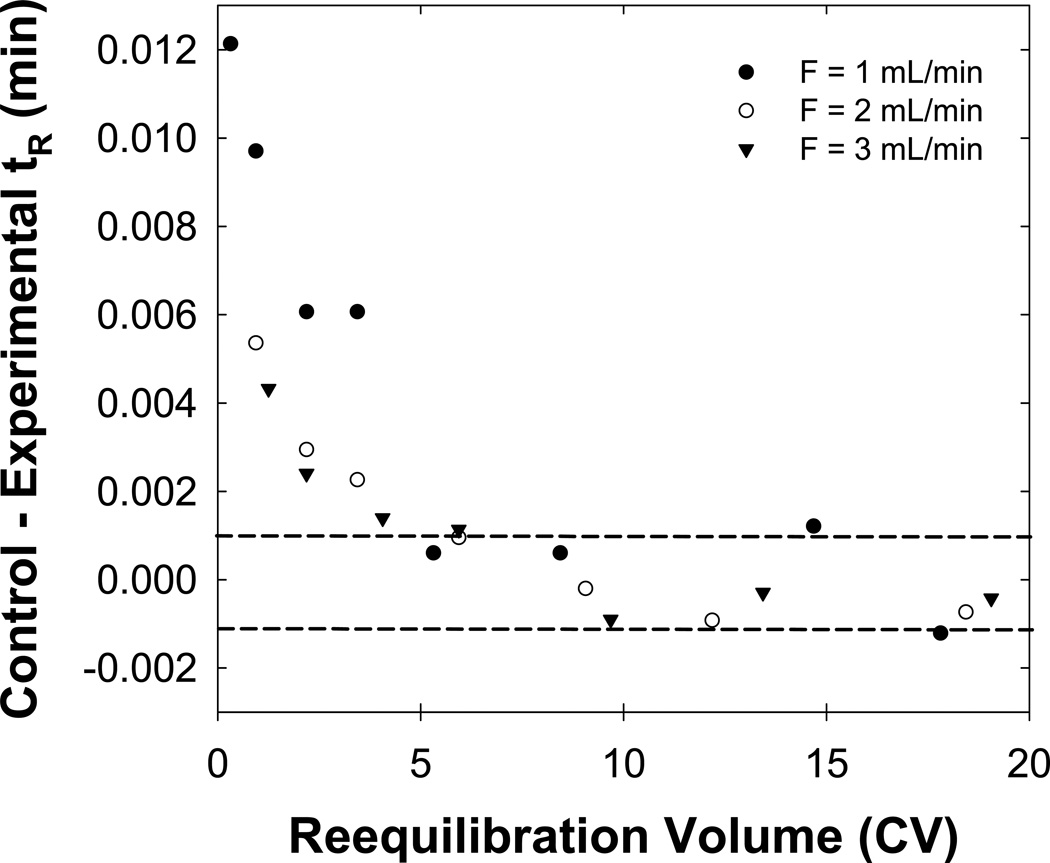
Fig. 4.
Effect of the flow rate on full equilibration. The dashed lines bracket a 0.002 min difference in the control and experimental retention time which represents a range in tR where the retention time of the solute is statistically constant based on the repeatability of the “worst” solute pheniramine. Flow rates of 1 mL/min (●), 2 mL/min (○) and 3 mL/min (▼) were used. Other conditions are described in Fig. 2.

