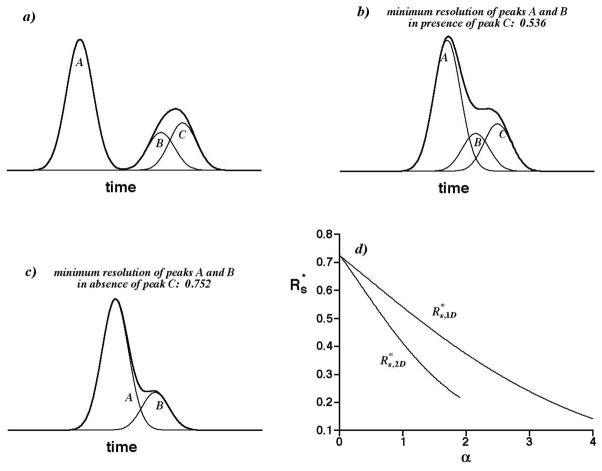
Figure 1.
a) Individual Gaussian peaks A, B, and C (——) and the detected signal from them (——). b) As in a), but with peak A shifted until two observed peaks (maxima) are barely observed. Axes are scaled as in a). c) As in b) but peak C is absent. d) Graph of the average minimum resolution vs. the saturation α for 1D separations ( ) and 2D separations ( ).

