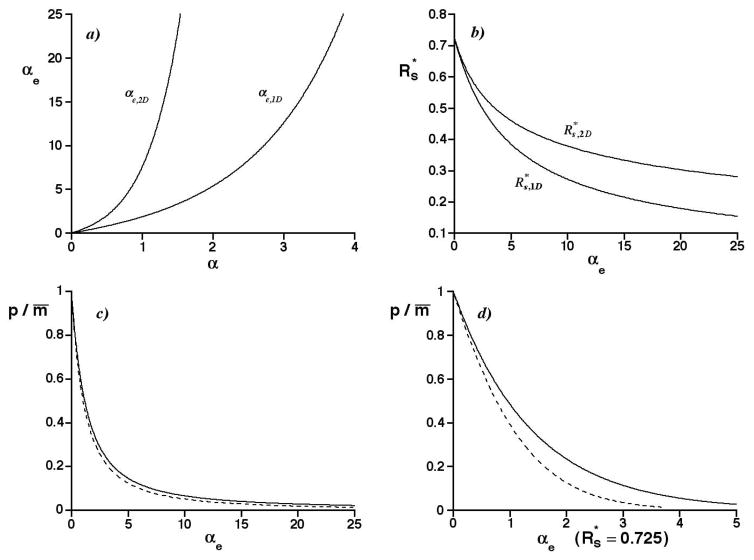
Figure 3.
a) Graph of the effective saturation αe vs. the saturation α for 1D separations (αe,1D) and 2D separations (αe,2D). b) Graph of the average minimum resolution vs. the effective saturation αe for 1D separations ( ) and 2D separations ( ). c) Graph of the p/m̄ ratio vs. the effective saturation αe for 1D separations (——; calculated from Eqs. 3 and 8, and Figure 1d) and unbounded 2D separations (- - -; calculated from Eqs. 7 and 9, and Figure 1d). d) As in c), but with αe determined by .

