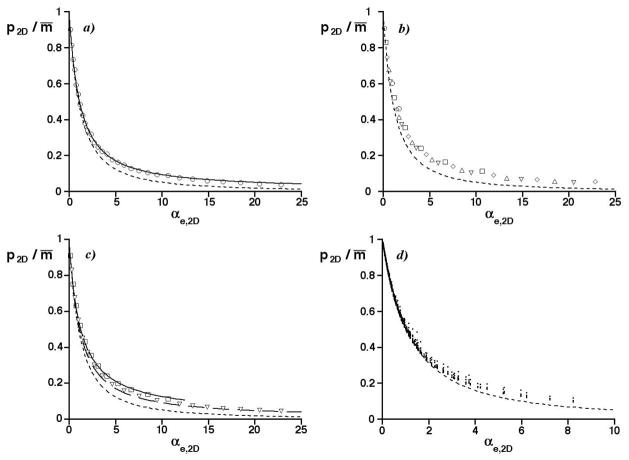
Figure 6.
Graphs of the ratio of the average numbers of observed peaks to mixture constituents (p2D/m̄) vs. the effective saturation (αe,2D). The prediction for an unbounded 2D separation is shown (- - -). a) Circles are simulation results in Figure 2b for m = 100; solid curve is the edge-effect corrected prediction for m̄ = 100. Aspect ratio: one. b) As in a) but for simulation results having an aspect ratio of 40. Symbols have the same meaning as in Figure 2b. c) As in b) but for m’s of 250 and 1000, with edge-effect corrected predictions for m̄ = 250 (——) and m̄ = 1000 (– –). d) As in a), but with the effective saturation αe,2D including the peak broadening factor < β>, Eq. 11. Circles are average results from 1436 sets of simulated c-2D separations with 100 to 550 randomly distributed peaks, aspect ratios of 40 or less, and ts/1σ ratios between 0.2 and 16 [34].

