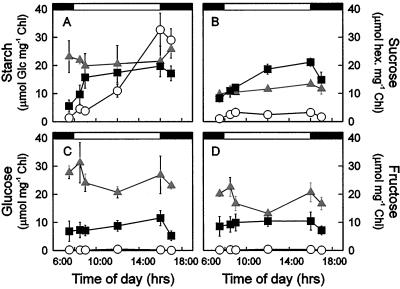
Figure 4.
Carbohydrate content for 23°C leaves (○), 23°C/5°C leaves ( ), and 5°C leaves (▪). Samples were frozen in the light at various times during the photoperiod at the temperature of liquid N2. Each point represents the mean ± sd of three different leaves from three different plants. The bar at the top of the graphs indicates the times when the lights were off (black bars) or on (white bars). Chl, Chlorophyll; hex, hexose.

