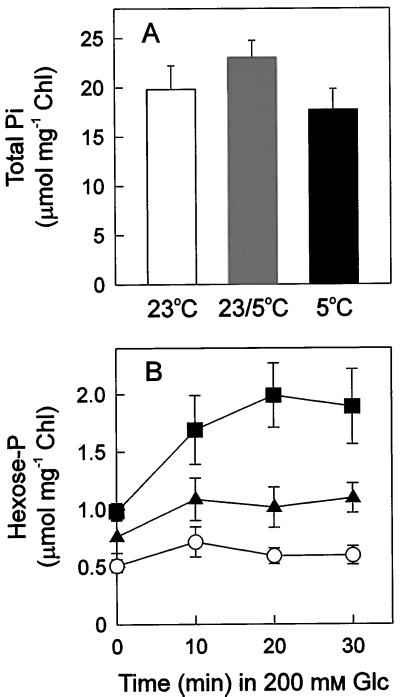
Figure 5.
Total Pi content (A) and available Pi pools (B) in Arabidopsis leaves. Leaf samples for the determination of total Pi were collected 2 h into the photoperiod by freezing in light at the temperature of liquid N2. To determine available Pi, 200 mm Glc was fed through the petiole in ambient light for 30 min. The increase in hexose-P was then determined. The figures show the results for 23°C leaves (open bars, ○), 23°C/5°C leaves (shaded bars, ), and 5°C leaves (black bars, ▪). Each value represents the mean ± sd of at least three different leaves. Chl, Chlorophyll.

