. 2007 Sep;9(3):291–300. doi: 10.31887/DCNS.2007.9.3/alewy

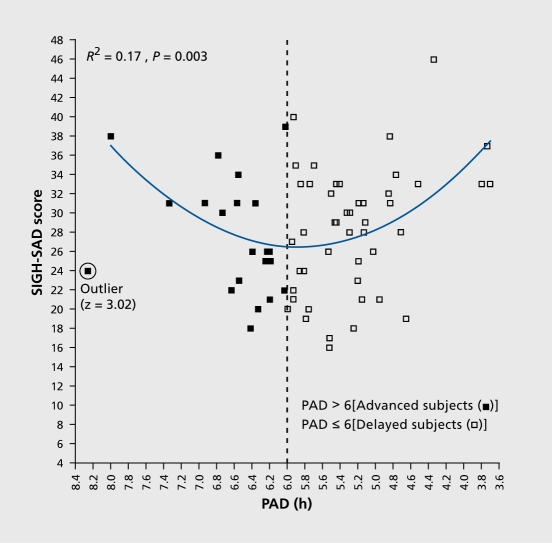
Figure 4. Pretreatment SIGH-SAD depression score as a function of PAD (the interval between the DLMO and midsleep, as shown in Figure3). (The circled data point from a 36-year-old female SAD subject who was assigned to placebo treatment was the only one that met outlier criteria [z =3.02] and was therefore removed from all subsequent analyses and did not substantially affect any of the above findings [no outliers were detected in any other analyses].) The parabolic curve (minimum =5.88) indicates that PAD accounts for 17% of the variance in SIGH-SAD scores (F [2, 65] =6.43). A significant linear correlation was found for the absolute deviation from the parabolic minimum (r=0.39, R2 =0. 15, df =65, P =0.001), confirming the validity of the parabolic curve fit. SAD, seasonal affective disorder; PAD, phase angle difference. Adapted from ref 20: Lewy AJ, Lefler BJ, Emens JS, Bauer VK. The circadian basis of winter depression. Proc Natl Acad Sci U S A. 2006:103:74147419. Copyright © National Academy of Sciences 2006.

Figure 4.