. 2007 Sep;9(3):291–300. doi: 10.31887/DCNS.2007.9.3/alewy

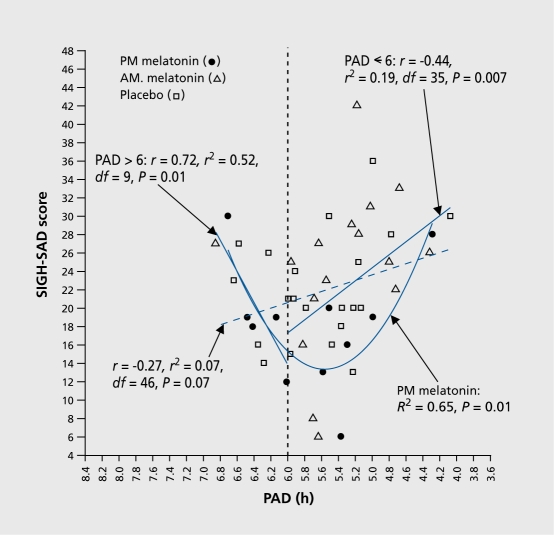
Figure 6. Post-treatment SIGH-SAD score as a function of PAD in delayed subjects. (The parabolic curve and related statistics for the delayed subjects are provided in Figure 4). The linear correlation between PAD and SIGH-SAD score (diagonal hatched line) did not reach statistical significance, confirming that the parabolic curve in Figure 4 for delayed subjects (R2=0.19, P=0.009) is the better fit for these data. Directional linear correlations for underand overshifters (to the right and left of PAD 6, respectively) were both statistically significant. The parabolic curve for subjects receiving PM melatonin indicates that PAD accounts for 65% of the variance in SIGH-SAD scores (F [2, 8] =7.57; minimum =5.56); the correlation between the absolute deviation from the parabolic minimum was also statistically significant (r=0.75, R2=056, df=8, P=0.001 SAD, seasonal affective disorder; PAD, phase angle difference. Adapted from ref 20: Lewy AJ, Lefler BJ, Emens JS, Bauer VK. The circadian basis of winter depression. Proc Natl Acad Sci U S A. 2006:103:74147419. Copyright © National Academy of Sciences 2006.

Figure 6.