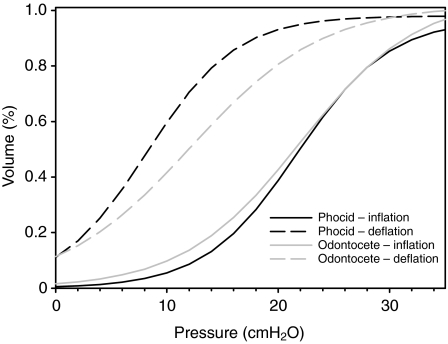
Fig. 4.
The inflation and deflation curves from fitting Eqn 1 to the data for the phocids and odontocetes. The inflation volume data were expressed as a proportion of the TLCest. The deflation data were expressed as a proportion of the maximum inflation volume (including the estimated residual volume of 7%) before each deflation.

