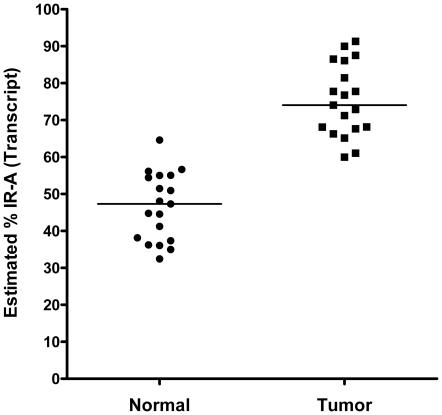
Figure 3. The proportion of IR-A expression in matched normal breast and breast cancer specimens.
Within sample proportion of insulin receptor isoform-A (IR-A) relative to total insulin receptor composition (ie, IR-A + IR-B) as determined by 2(-ΔCt) calculation. A paired sample t-test analysis indicated that a significant difference exists for calculated IR-A proportion between matched normal and tumor samples (P<0.001). Black bars represent the median IR-A proportion (%) within the normal (46.60±4.74, mean %±95% CI) and tumor (75.24±5.03, mean %±95% CI) tissue.

