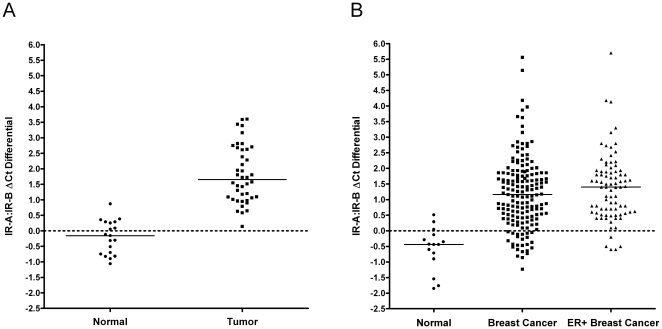
Figure 4. Increasing IR-A:IR-B ratio in primary breast cancer and breast cancer samples from qPCR cDNA array.
(A) Calculated ΔCt differentials of insulin receptor isoforms IR-A and IR-B in primary breast cancer samples: normal (n = 19) and tumor (n = 42) breast samples. (B) Calculated ΔCt differentials of insulin receptor isoforms IR-A and IR-B breast cancer samples from qPCR cDNA array: normal (n = 15), breast cancer cDNA panels (n = 168), and breast tumors from these cDNA panels with >2-fold estrogen receptor over-expression (n = 83). ΔCt differentials (IR-B ΔCt - IR-A ΔCt) values were calculated for all samples utilizing the within-sample reference gene panel (average Ct) for normalization purposes. A two-tailed Welch's t-test analysis identified a significant difference between normal and tumor samples in relation to observed IR-A:IR-B ΔCt differential (P<0.001). Black bars represent the median IR-A:IR-B ΔCt.

