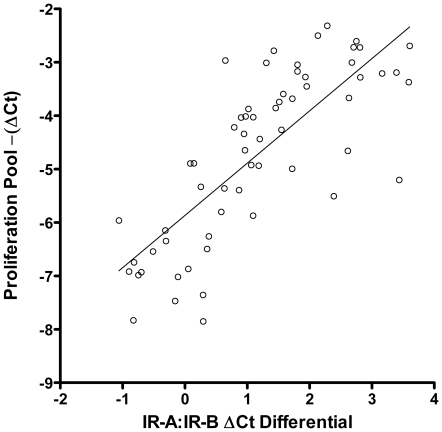
Figure 5. Correlation of IR-A:IR-B ΔCt differential with the expression of proliferation genes.
Linear regression analysis of the relationship between calculated IR-A:IR-B ΔCt differential (X axis) and a pooled panel of proliferation markers (AURKA, BIRC5, CCNB1, KI67, and MYBL2) (Y axis). Proliferation panel summary values were calculated by taking the mean –(ΔCt) across all markers for a particular sample. Summary results for both normal and tumor samples are presented. The linear regression analysis results suggest a positive correlation between the two summary values (ρ = 0.78).

