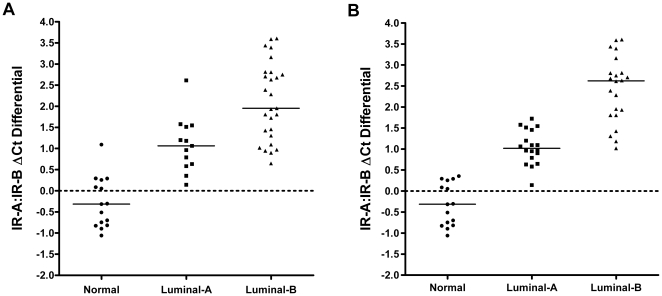
Figure 6. IR-A:IR-B ΔCt differential in subtypes of ER+ breast cancer.
Scatter plot representation of calculated IR-A:IR-B ΔCt differentials with regard to sample subtype (normal, luminal-A, or luminal-B) classification determined by a shrunken centroid classifier-based methodology (A) and a hierarchical clustering analysis (B). All subtype pair-wise comparisons display a significant difference (two-sample t-test, P<0.001). Black bars represent the median IR-A:IR-B ΔCt differential within a particular sample subtype.

