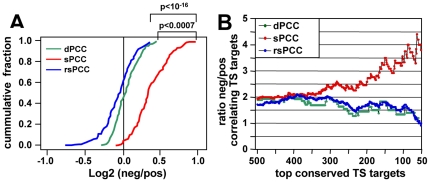
Figure 1. Performance of the NCI60 data sets to detect mRNA/miRNA correlations and to predict miRNA targets.
(A) Cumulative plot of log2 ratio of negatively vs. positively correlating gene numbers for 136 miRNAs calculated with the dPCC, sPCC and rsPCC methods, respectively. The X-axis denotes the log2 ratio values of 136 miRNAs according to their ranking from lowest to highest, and the Y-axis denotes the cumulative fraction of 136 miRNAs. The differences in the cumulative curves were measured by one-sided Kolmogorov-Smirnov Test. (B) Comparison of the three methods to identify the most likely conserved TargetScan predicted targets in the human genome (a total of 33,535 predicted targeting events). Target predictions were ranked by total context score from highest to lowest. Incrementally from top 50 to top 500 miRNA-gene pairs with the highest total context scores, the ratio values of negative vs. positive correlation numbers were calculated and plotted for the three methods.

