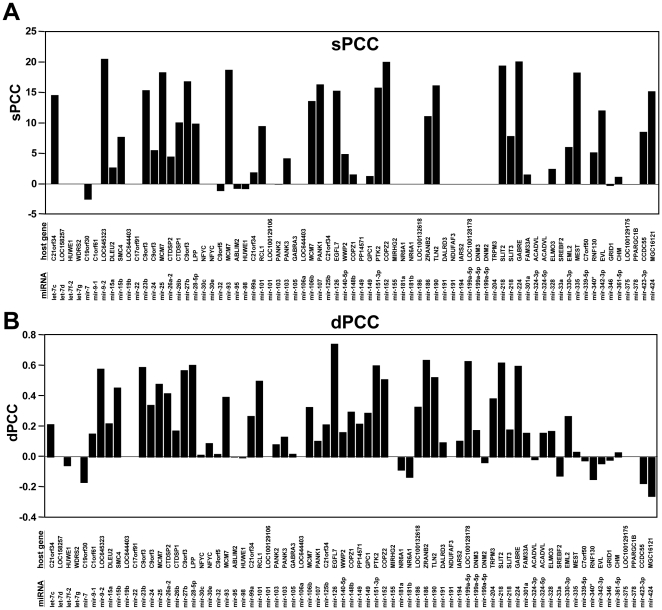
Figure 2. The endogenous miRNAs positively correlate with their host genes.
(A) sPCC and (B) dPCCs values are given for the 73 miRNA/host gene pairs represented in the Q data set and gene expression data sets which occurred with at least one of the methods. Reanalysis of the data by comparing sPCC/30 with dPCC values with a cutoff of 0.2 revealed that the two methods do not differ in their ability to predict host genes (either by paired t-test or paired Wilcoxon test).

