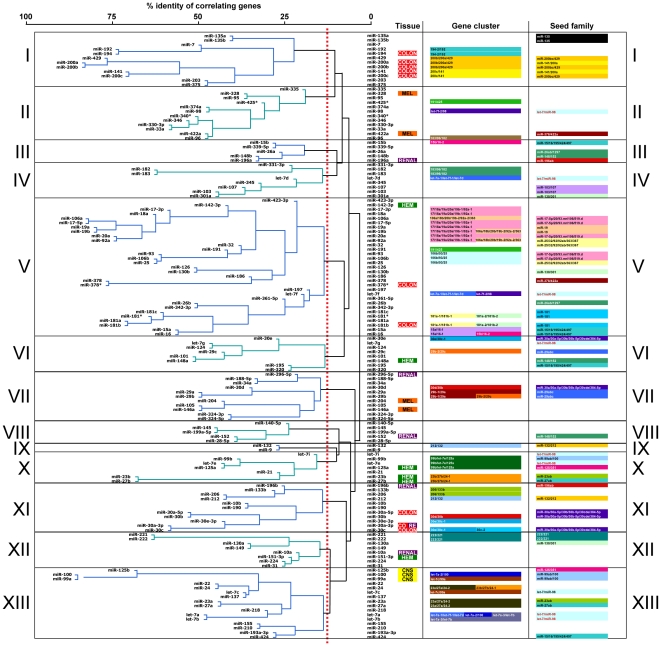
Figure 4. Cluster analysis of 136 miRNAs based on a pairwise comparison of positively correlating genes using the sPCC method.
The miRNAs were divided into 13 functional clusters (I–XIII). Information is given for each miRNA on tissue specific expression, genomic co-localization, and seed family. Stippled line: threshold of 12.5% of groups that was chosen to defined the 13 clusters.

