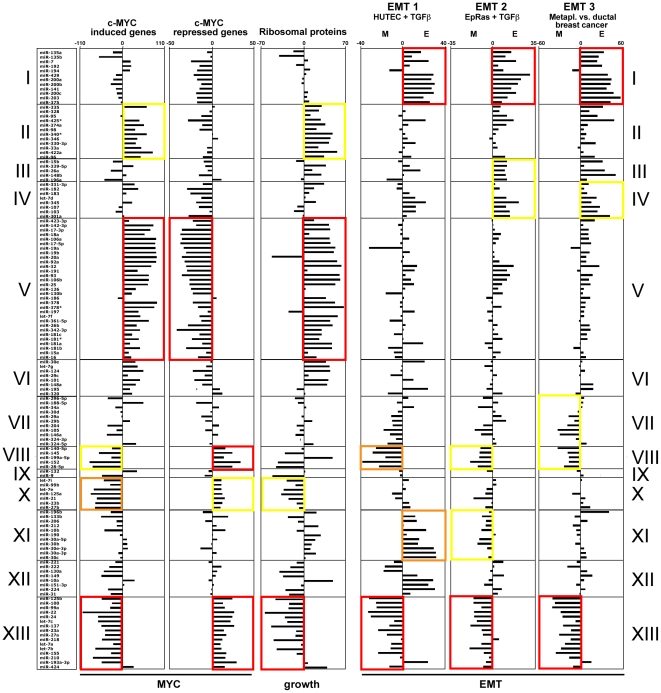
Figure 5. Correlation between selected gene signatures and the 13 miRNA functional clusters described in Figure 4 .
From left to right: Signatures of c-Myc regulated (induced and repressed) genes, ribosomal proteins (RPs) and 3 groups of EMT-related genes. For the c-Myc and RP signatures, each bar represents the number of genes that negatively correlate with a miRNA subtracted from the number of positively correlating genes. Details on the gene signatures and the calculation of the E and M factors used to analyze the EMT signatures are described in the Method section. Wilcoxon Rank-Sum Test was used to calculate significance for each functional cluster against the other clusters. Red, p<0.0001; orange, p<0.001; yellow, p<0.01.

