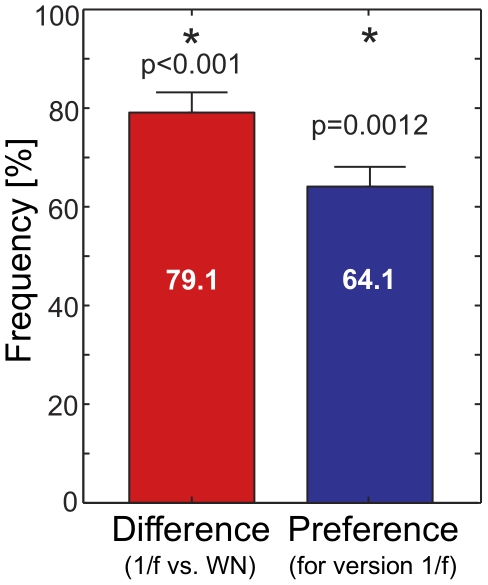
Figure 3. Perception analysis showing that  humanized music is preferred over white noise humanizing.
The versions  and WN (white noise) were compared by
  listeners. Two samples were played in random order to test subjects, all singers from Göttingen choirs, who were asked either one of two questions: (1) “Which sample sounds more precise?” (red bar) or (2) “Which sample do you prefer?” (blue bar) The answers to the first question provide clear evidence that listeners were able to perceive a difference between the two versions (t-test,
  ). Furthermore, the 1/f humanized version was significantly preferred to the WN version (t-test,
  ).
).

