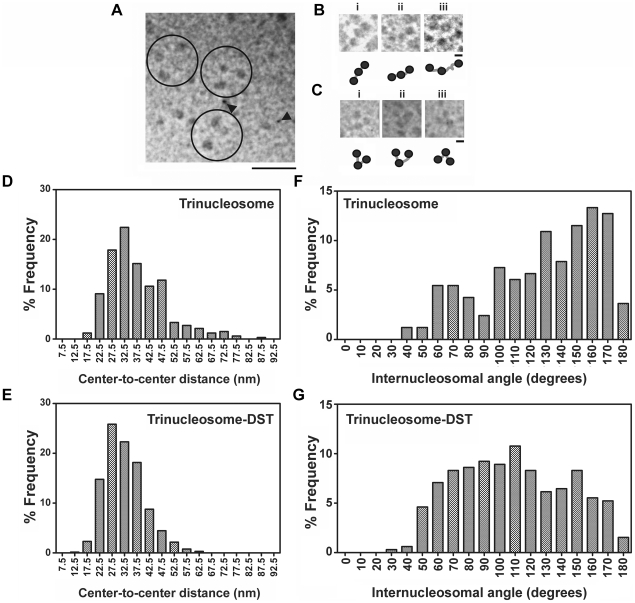
Figure 6. Analysis of trinucleosomes morphology.
(A) Survey view of a glutaraldehyde fixed trinucleosome fraction, shadowed with platinum. Some clearly defined trinucleosomes have been encircled. Black arrowheads indicate 7 nm nanosphere standards and scale bar indicates 100 nm. Three representative trinucleosomes are shown in higher magnification in (B). Scale bar indicates 20 nm. Three representative DST treated trinucleosomes are shown in (C). Scale bar is 20 nm. (D, E) Statistical analysis of the center to center distances of trinucleosomes. The percentage frequency of particles is plotted against the center to center distance in (D) free trinucleosomes and (E) DST treated trinucleosomes. Frequency distributions were obtained for 5 nm bin size. (F,G) Statistical analysis of the internucleosomal angles of trinucleosomes. The percentage frequency of particles was plotted against the internucleosomal projection angle in (F) free trinucleosomes and (G) DST treated trinucleosomes. The bin size for the frequency distribution was 10 degrees. DST treatment was performed at drug to DNA base ratio of 0.16.

