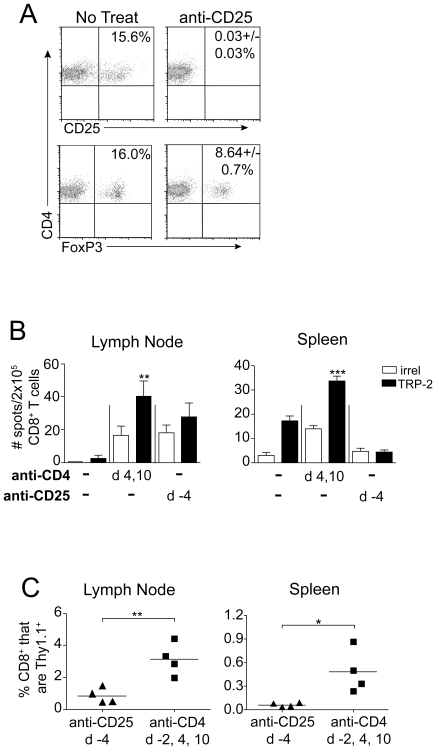
Figure 2. Treg depletion by anti-CD25 treatment fails to prime a CD8 T cell response to B16 melanoma.
(A) Mice received anti-CD25 (PC61) treatment, and four days later, the proportion of CD25+ and FoxP3+ cells among total CD4+ cells was determined by flow cytometry. Representative dot plots of 2–6 mice/group are shown; +/− standard deviation. (B) Mice received primary B16 tumors on day 0, and either anti-CD25 or anti-CD4 treatment was given as indicated in the figure. Mice were sacrificed on day 13, and IFN-γ ELISPOT was performed on CD8 T cells (pooled, 4–7 mice/group), with the indicated peptide-pulsed EL4 cells as targets. Data represent average ± SD of four replicate wells. (C) Mice received 104 naïve CD8+Thy1.1+ pmel cells on day −1, B16 tumors on day 0, and either anti-CD25 or anti-CD4 treatment was given as indicated in the figure. On day 13, the proportion of Thy1.1+ pmel cells among total CD8+ cells was determined by flow cytometry. Symbols represent individual mice and horizontal lines represent averages. Statistically significant differences were assessed by t test, with * P<0.05, ** P<0.01, *** P<0.001, and NS denoting P>0.05 as compared with irrelevant peptide (OVA)-pulsed EL4 cells, or as indicated by brackets. Data are representative of two experiments with similar results.

