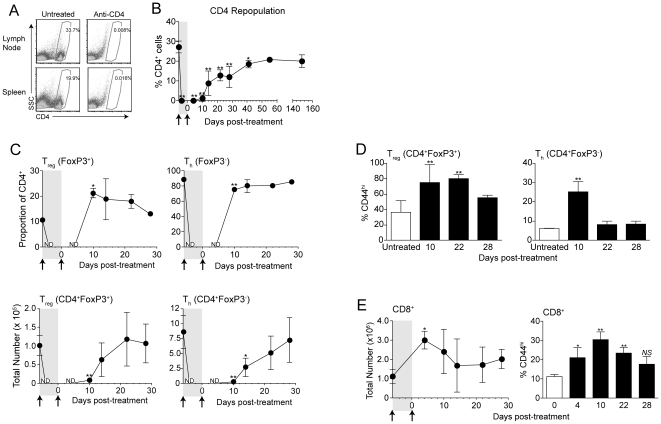
Figure 3. CD4 cells gradually repopulate after anti-CD4 treatment, concurrently with the homeostatic expansion of polyclonal CD8+ T cells.
(A) Mice received anti-CD4 treatment, and were sacrificed two days later. The proportion of CD4+ cells among live cells was determined by flow cytometry. Dot plots represent data from at least 4 mice per group, from 5 total experiments. (B–E) Mice were treated with anti-CD4 on day −6 and day 0, and inguinal lymph nodes were analyzed by flow cytometry at the indicated time points. (B) The proportion of CD4+ cells among live cells was determined by flow cytometry. (C) The proportion (top) and total number (bottom) of CD4+ cells expressing (left) or lacking (right) FoxP3 expression was determined at indicated time points. ND; not determined (<50 CD4+ events were detected). (D) The proportion of CD4+FoxP3+ (left) or CD4+FoxP3− (right) cells expressing CD44 as determined by flow cytometry. (E) The total number of CD8+ cells (left) and proportion of CD8+ cells expressing CD44 (right) after treatment as determined by flow cytometry. Error bars indicate average ± SD of 3–4 mice per time point. Statistically significant differences were determined by t test (C), or one-way ANOVA with Bonferroni post-test (B, D, & E) with * P<0.05 and ** P<0.01. Data for day 4, 10 and 14 time points were conducted thrice with similar results.

