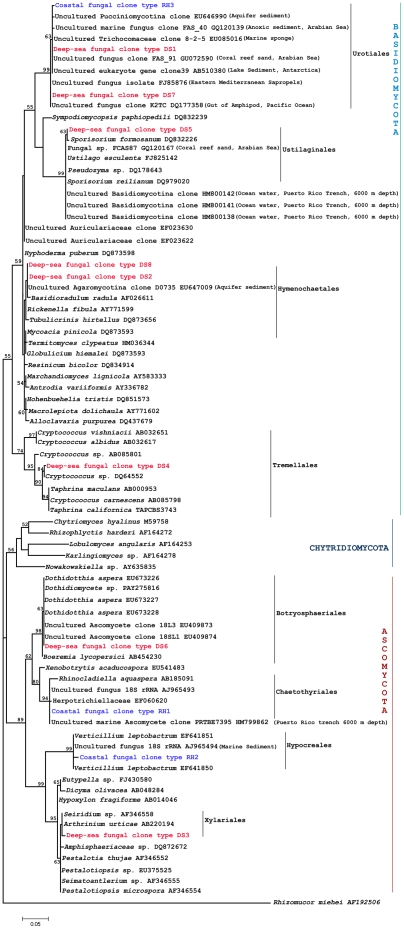
Figure 1. Maximum likelihood tree with bootstrap values constructed using fungal 18S rRNA sequences generated from this study and corresponding BLAST matches with highly identity scores recovered from GenBank and EMBL as well as published cultured fungal 18S rRNA sequences.
Bootstrap values for nodes greater than 50% are shown in the tree. The scale bar indicates 0.05 substitution per site.

