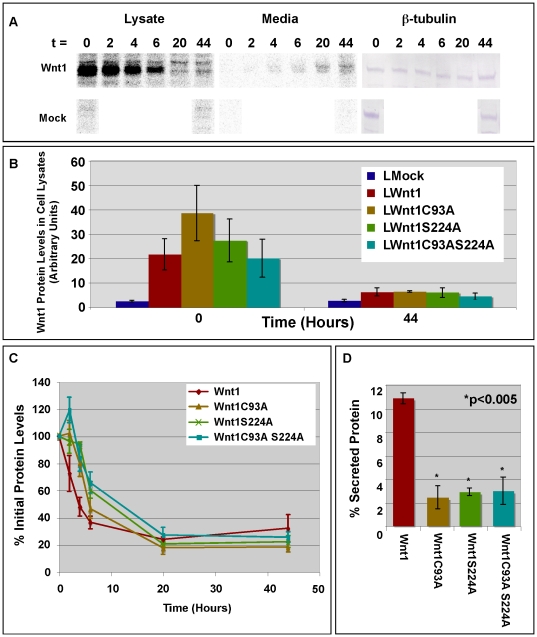
Figure 2. Pulse-chase analysis of Wnt1 stability and secretion.
Panel A: Stably transfected L cells were pulsed with 35S-cys and 35S-met for 4 hours prior to chasing for 0–44 hours with unlabeled media. Wnt1 was immunoprecipitated from cell lysates and media using anti-Wnt1 monoclonal antibodies developed in our lab [7]. Immunoprecipitated protein was separated by SDS-PAGE and subjected to analysis with a Kodak STORM Phosphorimager. A representative scan for wild-type Wnt1 is shown. As a control, a Western blot of total protein in the cell lysates prior to immunoprecipitations was also performed using antibodies against ß-tubulin. Panel B: This graph shows quantitation of the radiolabel in each sample (lysate only) as determined by Phosphorimaging. Data for mock transfected L cells and Wnt1 (wild-type and mutant) transfected L cells is shown for the 0 and 44 hr time points. These data were not normalized in any way. Data from 2–3 independent replicates is shown; error bars show standard error. Panel C: This graph shows quantitation of the total radiolabel in each sample (lysate+medium) as determined by Phosphorimaging. Identical exposures were used for cell lysates and media. Values for time = 0 are set to 100%. Data from 2 or 3 independent replicates is shown; error bars show the standard error. Panel D: This graph shows the percent of secreted Wnt1 protein (Mediummax/Lysatemax*100). Results from 2–3 independent replicates are shown. Error bars show standard error. The percentage of secreted Wnt1C93A, Wnt1S224A, and Wnt1C93AS224A are all significantly less than that of wild-type Wnt1 (p<0.005). However, there are no statistically significant differences between the various mutant Wnt1 proteins.

