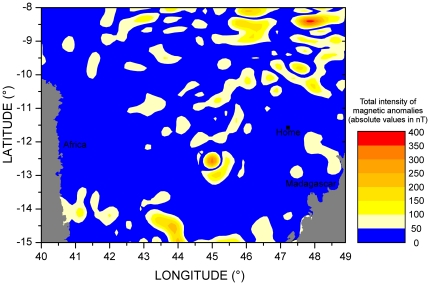
Figure 4. Map of geomagnetic anomalies around Glorieuses Islands (Home).
This map has been constructed as the absolute value of the difference in the total intensity between Enhanced Magnetic Model 2010 and World Magnetic Model 2010 (see www.ngdc.noaa.gov/geomag/). The former is a complete representation of the real magnetic field up to a spherical harmonic degree n = 720 (minimum wavelength L = 40000/n = 56 km, corresponding to a spatial accuracy of 28 km). The latter corresponds to the main (outer core) field model. The difference between the two models is a good representation of the crustal magnetic field.

