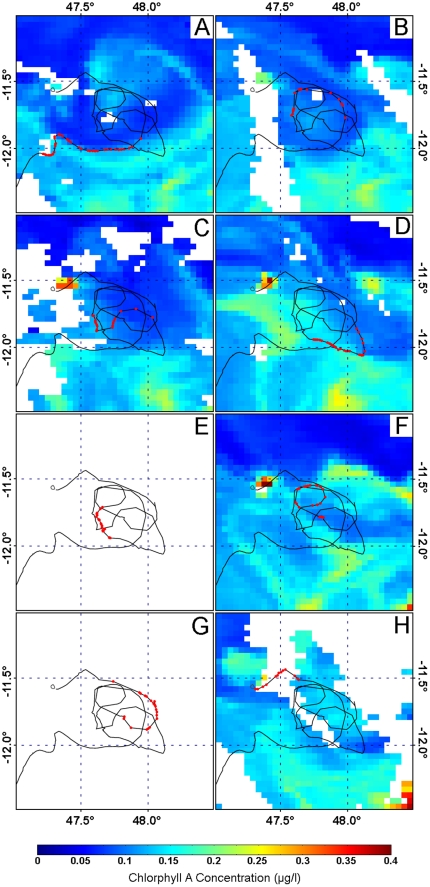
Figure 6. Daily maps of Chlorophyll A (ChA) concentration provided by MODIS-Aqua along with the last part of the homing path of turtle CO5, from 04 to 11 June 2009.
The red dots represent the turtle' GPS locations recorded the same day as the map, and therefore illustrate the homing movements possibly impacted by submesoscale activity. ChA concentration is considered as a passive tracer advected by the ocean dynamics. Coherent meso- and submeso-scale structures are clearly observed in this temporal image sequence and the high ChA concentration represents the borders of these oceanographic structures. In these areas the norm of the current motion field is higher. White pixels represent areas where ChA concentration cannot be measured due to the cloud cover. Panel A: the path was following the external active border of a dipole mesoscale structure, composed of two eddies (not detectable as sea level anomalies because of theirs small sizes): the anticyclonic part is centered at 11.5°S–47.8°E and the cyclonic one at 11.7°S–47.4°E. Panel B: the dipole structure moved to south-east. The turtle was advected by the cyclonic eddy of the dipole. The displacement of the turtle followed the internal border of the cyclonic eddy. Panel C: the turtle reached the cyclonic structure to enter in a complex ocean dynamics configuration created by ejection of numerous energetic filaments by the principal dipole structure described in panel A. Panel D: ChA concentration increased and the different ejection filaments can be clearly represented. Panel E: no data available because of cloud cover. Panel F: the turtle turned around a submesoscale structure but the mixing of ChA is too high and gradient too low to have a clear detection of this submesoscale structure. Panels G & H: no ChA data available for the turtle's locations because of cloud cover.

