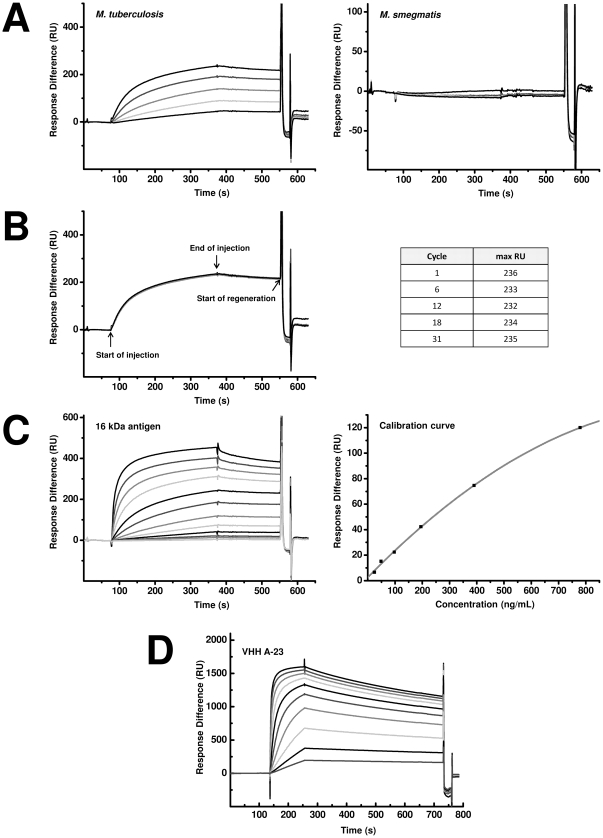
Figure 5. Surface plasmon resonance analysis to show specific binding of VHHs to soluble antigen.
A–C) VHH A-23 immobilized at 3818 RU on a CM5 sensor chip in Fc4 and VHH M200 [22] immobilized at 3851 RU in the reference channel Fc3. Sensorgrams were corrected by subtracting the signal from the reference flow channel Fc3. A) Sensorgrams obtained after injection of M. tuberculosis (left) and M. smegmatis (right) lysate. 50 µL lysate at concentration of 3.8 (lowest), 7.5, 15, 30 and 60 (highest) µg/mL were injected at a constant flow (10 µL/min.). B) Sensorgrams obtained after repeated injection of M. tuberculosis lysate. 50 µL lysate at concentration of 60 µg/mL were repeatedly injected at a constant flow (10 µL/min.). Sensor was regenerated with 5 µL of a 10 mM HCl solution at 10 µL/min after each run. C) Left: Sensorgrams achieved after injection of purified recombinant 16 kDa antigen. 50 µL lysate at concentration of 24 (lowest), 49, 98, 185, 391, 781, 1.6×10³, 3.1×10³, 6.3×10³, 12.5×10³, 25×103 and 50×103 (highest) ng/mL were injected at a constant flow (10 µL/min.). Right: Calibration curve of purified recombinant 16 kDa antigen as obtained by BIAevaluation using the 4 parameter fit. D) Sensorgrams achieved after injection of VHH A-23. Purified recombinant 16 kDa antigen was immobilized at 4100 RU on a CM5 sensor chip in Fc2 and inactivated Fc1 was used as reference. 100 µL VHH at concentration of 0.025 (lowest), 0.05, 0.1, 0.2, 0.4, 0.8, 1.6, 3.2, 6.3 and 12.5 (highest) µg/mL were injected at a constant flow (50 µL/min.). Sensorgrams were corrected by subtracting the signal from the reference flow channel Fc1. To obtain the dissociation equilibrium constant (KD) the sensorgrams were fitted by a global Langmuir 1∶1 model (BIAevaluation software) using the six lowest VHH concentrations.

